
Bokeh
Bokeh is a data visualization library that allows a developer to code in Python and output JavaScript charts and visuals in web browsers.
Why is Bokeh a useful library?
Web browsers are ideal clients for consuming interactive visualizations. However, libraries such as d3.js can be difficult to learn and time consuming to connect to your Python backend web app. Bokeh instead generates the JavaScript for your application while you write all your code in Python. The removal of context switching between the two programming languages can make it easier and faster to create charts and visualizations.
What do Bokeh visualizations look like?
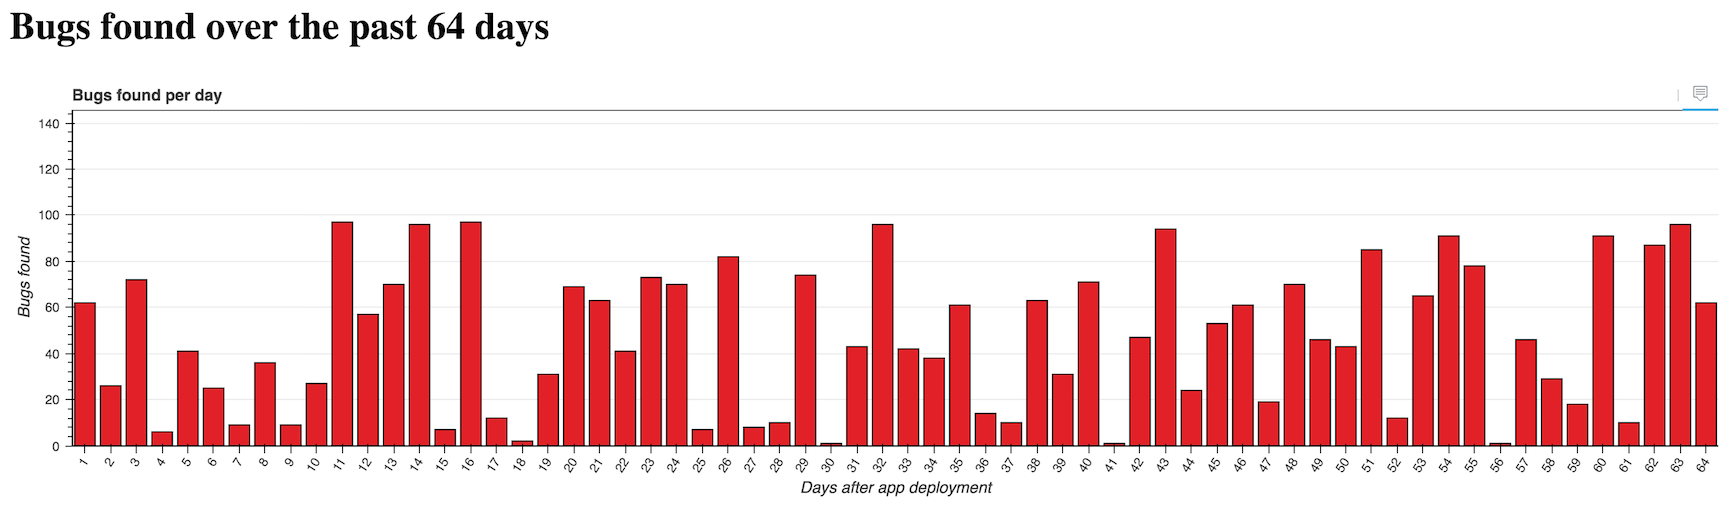
Bokeh can create any type of custom graph or visualization. For example, here is a screenshot of a bar chart created with the figure plot:
For more references, including interactive live demonstrations, check out these sites:
-
The official Bokeh gallery has many example Bokeh visual formats.
-
Bokeh Applications hosts numerous data visualizations built with Bokeh.
Bokeh resources
Bokeh is under heavy development ahead of the upcoming 1.0 release. Note that while all of the following tutorials are useful, it is possible some of the basic syntax will change as the library's API is not yet stable.
-
Responsive Bar Charts with Bokeh, Flask and Python 3 is my recommended tutorial for those new to Bokeh who want to try out the library and get an example project running quickly with Flask.
-
Fun with NFL Stats, Bokeh, and Pandas takes an NFL play-by-play data set, shows how to wrangle the data into an appropriate format then explains the code that uses Bokeh to visualize it.
-
Data is beautiful: Visualizing Roman imperial dynasties provides a walkthrough for creating a gorgeous visualization based on historical Roman data. The post is about more than just the visual, it also goes into the ideation, data wrangling and analysis phases that came before using Bokeh to show the results.
-
Visualizing with Bokeh gives a detailed explanation with the code for number Bokeh visuals you can output while working with a pandas data set.
-
Interactive Data Visualization in Python With Bokeh is a great beginners tutorial that shows you how to structure your data, draw your first figures and add interactivity to the visualizations.
-
Creating Bar Chart Visuals with Bokeh, Bottle and Python 3 is a tutorial that combines the Bottle web framework
-
Building Bullet Graphs and Waterfall Charts with Bokeh covers buildings two types of useful visualizations into your applications using Bokeh.
-
Interactive Visualization of Australian Wine Ratings builds a non-trivial visualization with a nice sample set of data based on wine ratings.
-
Drawing a Brain with Bokeh is a fun example of a chord diagram that represents neural connections in the brain.
-
Bryan Van de Ven on Bokeh is a podcast episode by one of the main Bokeh maintainers.
-
The Python Visualization Landscape by Jake VanderPlas at PyCon 2017 covers many Python data visualization tools, including Bokeh.
-
This flask-bokeh-example project has the code to create a simple chart with Bokeh and Flask.
-
Bokeh vs Dash — Which is the Best Dashboard Framework for Python? contains a single project that was written in both Dash and Bokeh. The author gives his subjective view on the implementation difficulty although the web application only contained a single type of data visualization so it is hard to drawn any real conclusions from his opinion.
您还想了解有关 Python 和数据的其他信息?
Sponsored By

Fix errors in your Python code before your users see them by monitoring with Rollbar.
Learn More Python
Deploy web apps with the Ansible configuration management tool.

Build microservices with Docker, Flask & React in this great course.
Full Stack Python
Updates via newsletter, Twitter & Facebook.